Catholic Candle note: The globalists are seeking to grab power by frightening gullible people that there is a climate emergency that requires the globalists to save us by wielding totalitarian power for our own good. https://catholiccandle.org/2019/12/22/the-baseless-climate-change/
These globalists falsify and deceptively use climate data as part of their scheme to alarm people with a supposed global-warming emergency. In roughly the 1970s, the globalists tried (and largely succeeded) in alarming people by the scare of global cooling and the (supposed) coming of a “new ice age”. https://catholiccandle.org/2022/10/25/recalling-a-1970s-climate-change-hoax/
The globalists use cyclical climate trends to alarm the people, as if the climate cycle was going to continue without end in the same direction. In an earlier article, we examined the fact that the climate is naturally cyclical. There are daily cycles, yearly cycles, decades-long cycles and centuries-long cycles. Read this article: Climate Alarmists Abuse Data from Natural Weather Cycles: https://catholiccandle.org/2023/02/24/climate-alarmists-abuse-data-from-natural-weather-cycles/
The article below treats of a related topic, debunking the claims of the climate alarmists who assert that hurricanes are becoming more numerous and more severe because of man-made (anthropogenic) “climate change”.
Part 1
The leftists seek to alarm gullible people (especially the young) by claiming that the current warming cycle (which the leftists call “global warming”) is harmful because this warming causes hurricanes to be more numerous and more severe. This alarmism is false as we will see.
Just as the temperature goes in long and in short-term cycles, it would not surprise any thinking person that hurricanes go in cycles too. There is an obvious annual hurricane cycle, because of which part of the year is called the “hurricane season”, especially in places such as the Gulf of Mexico. Here is a NOAA (U.S. National Oceanic and Atmospheric Administration) graph of the annual hurricane cycle:

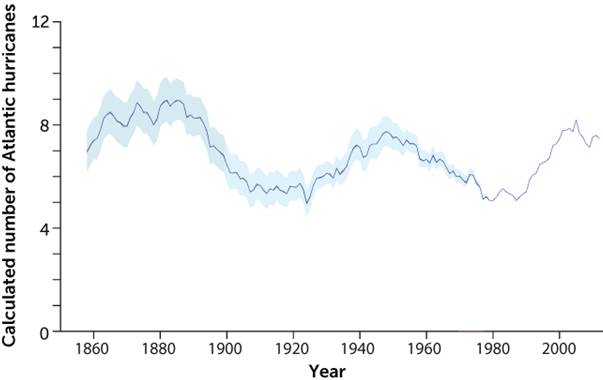
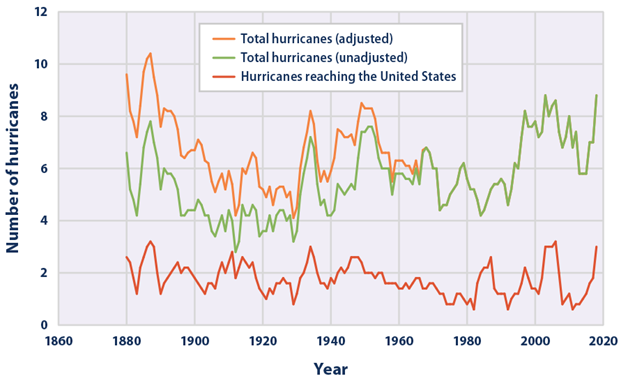
In addition to those annual cycles, hurricanes also follow decades-long cycles. Below are some graphs showing such decades-long cycles. The first one[1] is averaged to make the graph less “spikey”. The second one[2] (the one from the U.S. E.P.A. i.e., the Environmental Protection Agency) is the non-averaged, “spikier” version of the first graph. We see that both of them display a cyclical pattern that takes decades to repeat itself.
It would seem plausible that there would also be hurricane cycles that take centuries to repeat, just as there are centuries-long temperature cycles.[3] But we have no information on that question, one way or the other.
Regarding these hurricane cycle graphs (above), notice that the U.S. E.P.A. graph refers to the pre-1972 data being “adjusted”. The U.S. government began wide-spread use of weather satellites that year. The U.S. government and academic researchers all adjust the pre-1972 data and they all agree that an upward adjustment is necessary because the pre-1972 data for hurricanes missed all hurricanes that did not reach landfall unless a ship at sea happened to see the hurricane. It is reasonable and obvious to everybody that this pre-1972 tracking system missed many hurricanes and so the data is adjusted upward to account for this under-count in both government and academic records.
Because hurricanes occur in cycles (like the weather more generally), this enables climate alarmists to manipulate the hurricane data to have it “prove” what they want. So, e.g., “cutting” the data (i.e., starting their graph) at a low point allows the climate alarmists to claim that the upward slope of the normal hurricane cycle “proves” that there is an “alarming” hurricane increase (which they blame on a global warming emergency).
Although the government weather and climate services, as well as academia (university researchers) are controlled by the leftists, they cannot entirely avoid the truth that the climate data does not support climate alarmism. So, when government or university reports dispel alarmist myths, those reports are “buried” and de-emphasized, all the while the leftist media, academia, and government agencies continue to insist on dire climate danger and the need for drastic reductions in human-caused carbon emissions.
One example of the truth coming out recently – but being “buried” – is a NOAA hurricane study that came out in October 2022. Immediately below are NOAA’s conclusions regarding no trend in the strengthening of storms which would cause them to become major hurricanes:
After adjusting for changes in observing capabilities (limited ship observations) in the pre-satellite era, there is no significant long-term trend (since the 1880s) in the proportion of hurricanes that become major hurricanes. We conclude that the historical Atlantic hurricane data at this stage do not provide compelling evidence for a substantial greenhouse warming-induced century-scale increase in frequency of tropical storms, hurricanes, or major hurricanes, or in the proportion of hurricanes that become major.[4]
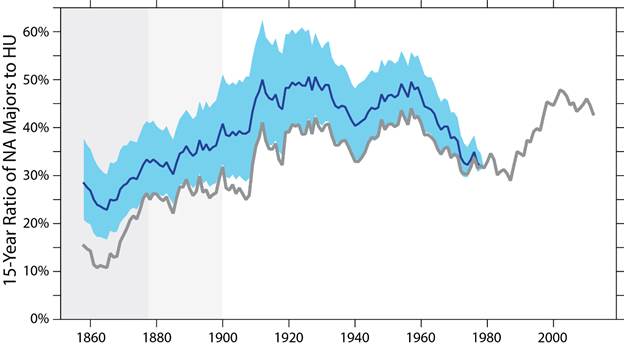
NOAA provides the graph (below) of 160 years of data, adjusted to account for inferior sighting and tracking ability before 1972. This graph, is called “figure 4” in the NOAA report. The graph not only does not show an increasing proportion of hurricanes becoming major, but rather it shows greater proportions of hurricanes being major in the 1960s hurricane cycle (compared to now) and an even-greater proportion of major storms in the 1910-1930s cycle. See below.[5]
NOAA is telling us that the evidence shows cycles but shows no “significant long-term trend (since the 1880s) in the proportion of hurricanes that become major hurricanes”. NOAA adds (in the quote above) that there is no “compelling evidence” that greenhouse gases cause more storms to become major hurricanes – although the climate alarmists insist the opposite.
NOAA (despite being controlled by leftists) admits that the data does not support the supposition that there is an increase in the severity of hurricanes, once a person adjusts (as all the studies do) for the obvious under-count which occurred when hurricanes were counted by chance ship observations rather than by ever-“watching” satellites, as occurred beginning about 1972.
Let us look again at the graph above. We see from graphs such as this one that in roughly 1980, there was the bottom (trough) of a down cycle. In fact, here is a lengthy study, Changes in Atlantic major hurricane frequency since the late-19th century, which observes on this issue:
Nevertheless, the recent increase in the proportion of NA HUs [i.e., North American Hurricanes] becoming MHs [i.e., major hurricanes], after adjustment, which is also reflected in the results of ref. 14, [which is a data source on which this report relies] is not a continuation or acceleration of a long-term trend, but rather is a rebound from a deep minimum in the decades surrounding the 1980s ….
We find that recorded century-scale increases in Atlantic hurricane and major hurricane frequency, and associated decrease in USA hurricanes strike fraction, are consistent with changes in observing practices and not likely a true climate trend. After homogenization, increases in basin-wide hurricane and major hurricane activity since the 1970s are not part of a century-scale increase, but a recovery from a deep minimum in the 1960s–1980s. …
Our results indicate that the recent increase in NA basin-wide MH/HU ratio or MH frequency is not part of a century-scale increase. Rather it is a rebound from a deep local minimum in the 1960s–1980s. …
[T]he inactive period in the late 20th century may have been the most inactive period in recent centuries.[6]
Notice in the graph above that a person could cut the graph at roughly 1980 if he wanted to fool gullible people into believing that hurricanes are becoming more intense. This is because graphs or data sets that begin in roughly 1980 lack the context of the fact that 1980 is the trough of a prior cycle. Such a graph misleadingly shows an increase in hurricanes and major hurricanes which make the graph or data look as if there is an alarming acceleration in these storms, as the climate extremists falsely claim. This same hurricane study remarks about this false appearance in these words:
Furthermore, the 1980–2019 increases in basin-wide HU [i.e., hurricanes] and MH [i.e., major hurricanes] frequency are not a continuation of a longer-term trend, but reflect a recovery from a strong minimum in the 1970s and 1980s ….[7]
Now let us look at the leftists’ other alarmist hurricane assertion, viz., that anthropogenic (human-caused) greenhouse gases are causing a greater number of hurricanes.
NOAA’s report concludes that, aside from the usual hurricane cycles, there is no trend toward an increasing number of hurricanes – after adjusting for under-counting in the pre-satellite data. Here are NOAA’s conclusions:
After adjusting for a likely under-count of hurricanes in the pre-satellite era, there is essentially no long-term trend in hurricane counts. The evidence for an upward trend is even weaker if we look at U.S. landfalling hurricanes, which even show a slight negative trend beginning from 1900 or from the late 1800s.[8]
NOAA’s report combines and summarizes its findings as follows:
We conclude that the historical Atlantic hurricane data at this stage do not provide compelling evidence for a substantial greenhouse warming-induced century-scale increase in frequency of tropical storms, hurricanes, or major hurricanes, or in the proportion of hurricanes that become major hurricanes.[9]
We see that even the leftist-controlled NOAA is admitting that it is false to say that greenhouse gases are causing a greater number of hurricanes or a larger number of major hurricanes. But these truths do not change what the leftists are claiming in the mainstream media, academia, and government because the leftists are not seeking the truth (as Karl Marx did not seek the truth). Instead, the leftists seek to complete their globalist power grab.
The leftists would be embarrassed by reports such as the NOAA, Vecchi, and Nature reports above, if those reports became well-known to the public. But the leftist know that few people will ever know the truth because their comrades in the media will “bury” these reports in silence and their comrades in the universities will continue to lie to their students that hurricane frequency and severity “prove” that there is an anthropogenic climate crisis.
Conclusion of Part 1 of this Article
We see that weather and climate go in cycles and that this applies to hurricanes, too. We see that NOAA (and the studies it relies on) conclude that, after adjusting for the pre-1972 hurricane under-count, there is no upward trend in the number or in the severity of hurricanes.
We see that there was a deep trough in the hurricane cycle – in approximately 1980 – which would allow a dishonest manipulation of the data by deceptively cutting the data there in order to give a false appearance of an alarming hurricane increase, as the climate alarmists fraudulently claim.
Remember this trough in 1980 because next month we will look at deceptive alarmist graphs beginning then.
To be continued
[1] This graph is taken from: From https://www.sciencenews.org/article/hurricanes-frequency-danger-climate-change-atlantic
[2] This graph is taken from: https://www.epa.gov/climate-indicators/climate-change-indicators-tropical-cyclone-activity
[4] Quoted from the report by the National Oceanic and Atmospheric Administration, Geophysical Fluid Dynamics Laboratory, found here: https://www.gfdl.noaa.gov/global-warming-and-hurricanes/ (parenthetical words in the original; emphasis added).
[5] Quoted from the report by the National Oceanic and Atmospheric Administration, Geophysical Fluid Dynamics Laboratory, found here: https://www.gfdl.noaa.gov/global-warming-and-hurricanes/ at figure 4, ratio of Atlantic major hurricanes (Cat 3-5) to all hurricanes (Cat 1-5). The gray curve is prior to adjustment; blue curves include an adjustment for estimated missing storms. This graph and data were originally published in Vecchi et al. 2021.
The reference to “Vecchi et al., 2021” in NOAA’s graph description (quoted immediately above), is merely NOAA’s attributing the source of the graph that it was using. This study and report, issued by the National Oceanic and Atmospheric Administration’s Geophysical Fluid Dynamics Laboratory, is available here: https://www.gfdl.noaa.gov/global-warming-and-hurricanes/
[6] Changes in Atlantic major hurricane frequency since the late-19th century https://www.nature.com/articles/s41467-021-24268-5, citing (in the statements above) the following studies:
❖ Kossin, J. P., Knapp, K. R., Olander, T. L. & Velden, C. S. Global increase in major tropical cyclone exceedance probability over the past four decades, Proc. Natil Acad. Sci. USA 117, 11975–11980 (2020) in “ref. 14”;
❖ Chenoweth, M. & Divine, D. A document-based 318-year record of tropical cyclones in the Lesser Antilles, 1690 – 2007. Geo- chem. Geophys. Geosyst. 9, Q08013 (2008); and
❖ Nyberg, J. et al., Low Atlantic hurricane activity in the 1970s and 1980s compared to the past 270 years, Nature, 447, 698–701 (2007).
Emphasis added and bracketed comments added for clarity.
[7] Changes in Atlantic major hurricane frequency since the late-19th century, https://www.nature.com/articles/s41467-021-24268-5 Emphasis added.
[8] Quoted from the report by the National Oceanic and Atmospheric Administration, Geophysical Fluid Dynamics Laboratory, found here: https://www.gfdl.noaa.gov/global-warming-and-hurricanes/
[9] Quoted from the report by the National Oceanic and Atmospheric Administration, Geophysical Fluid Dynamics Laboratory, found here: https://www.gfdl.noaa.gov/global-warming-and-hurricanes/