Catholic Candle note: Below is the second
and final part of an article which debunks the claim of the climate alarmists
who assert that hurricanes are becoming more numerous and more severe because
of man-made (anthropogenic) “climate change”. The first part of this article
is here: https://catholiccandle.org/2023/04/28/the-false-claim-that-global-warming-causes-hurricanes-to-be-more-severe/
In part one of
this article, we saw that weather and climate go in cycles and that this
applies to hurricanes, too. We saw that N.O.A.A. (U.S. National Oceanic and
Atmospheric Administration) and various studies conclude that, after adjusting
for the pre-1972 hurricane under-count (before the use of weather satellites),
there is no upward trend in the number or in the severity of hurricanes.
We saw that
there was a deep trough in the hurricane cycle – in approximately 1980 – which
would allow a dishonest manipulation of the data by deceptively cutting the
data to begin there in order to give a false appearance of an alarming
hurricane increase, as the climate alarmists falsely claim.
Now, in the
second and final part of this article, we look at the mainstream media making
these false claims based on deceptively cutting the data and answer an
objection concerning the increasing cost of hurricane damage.
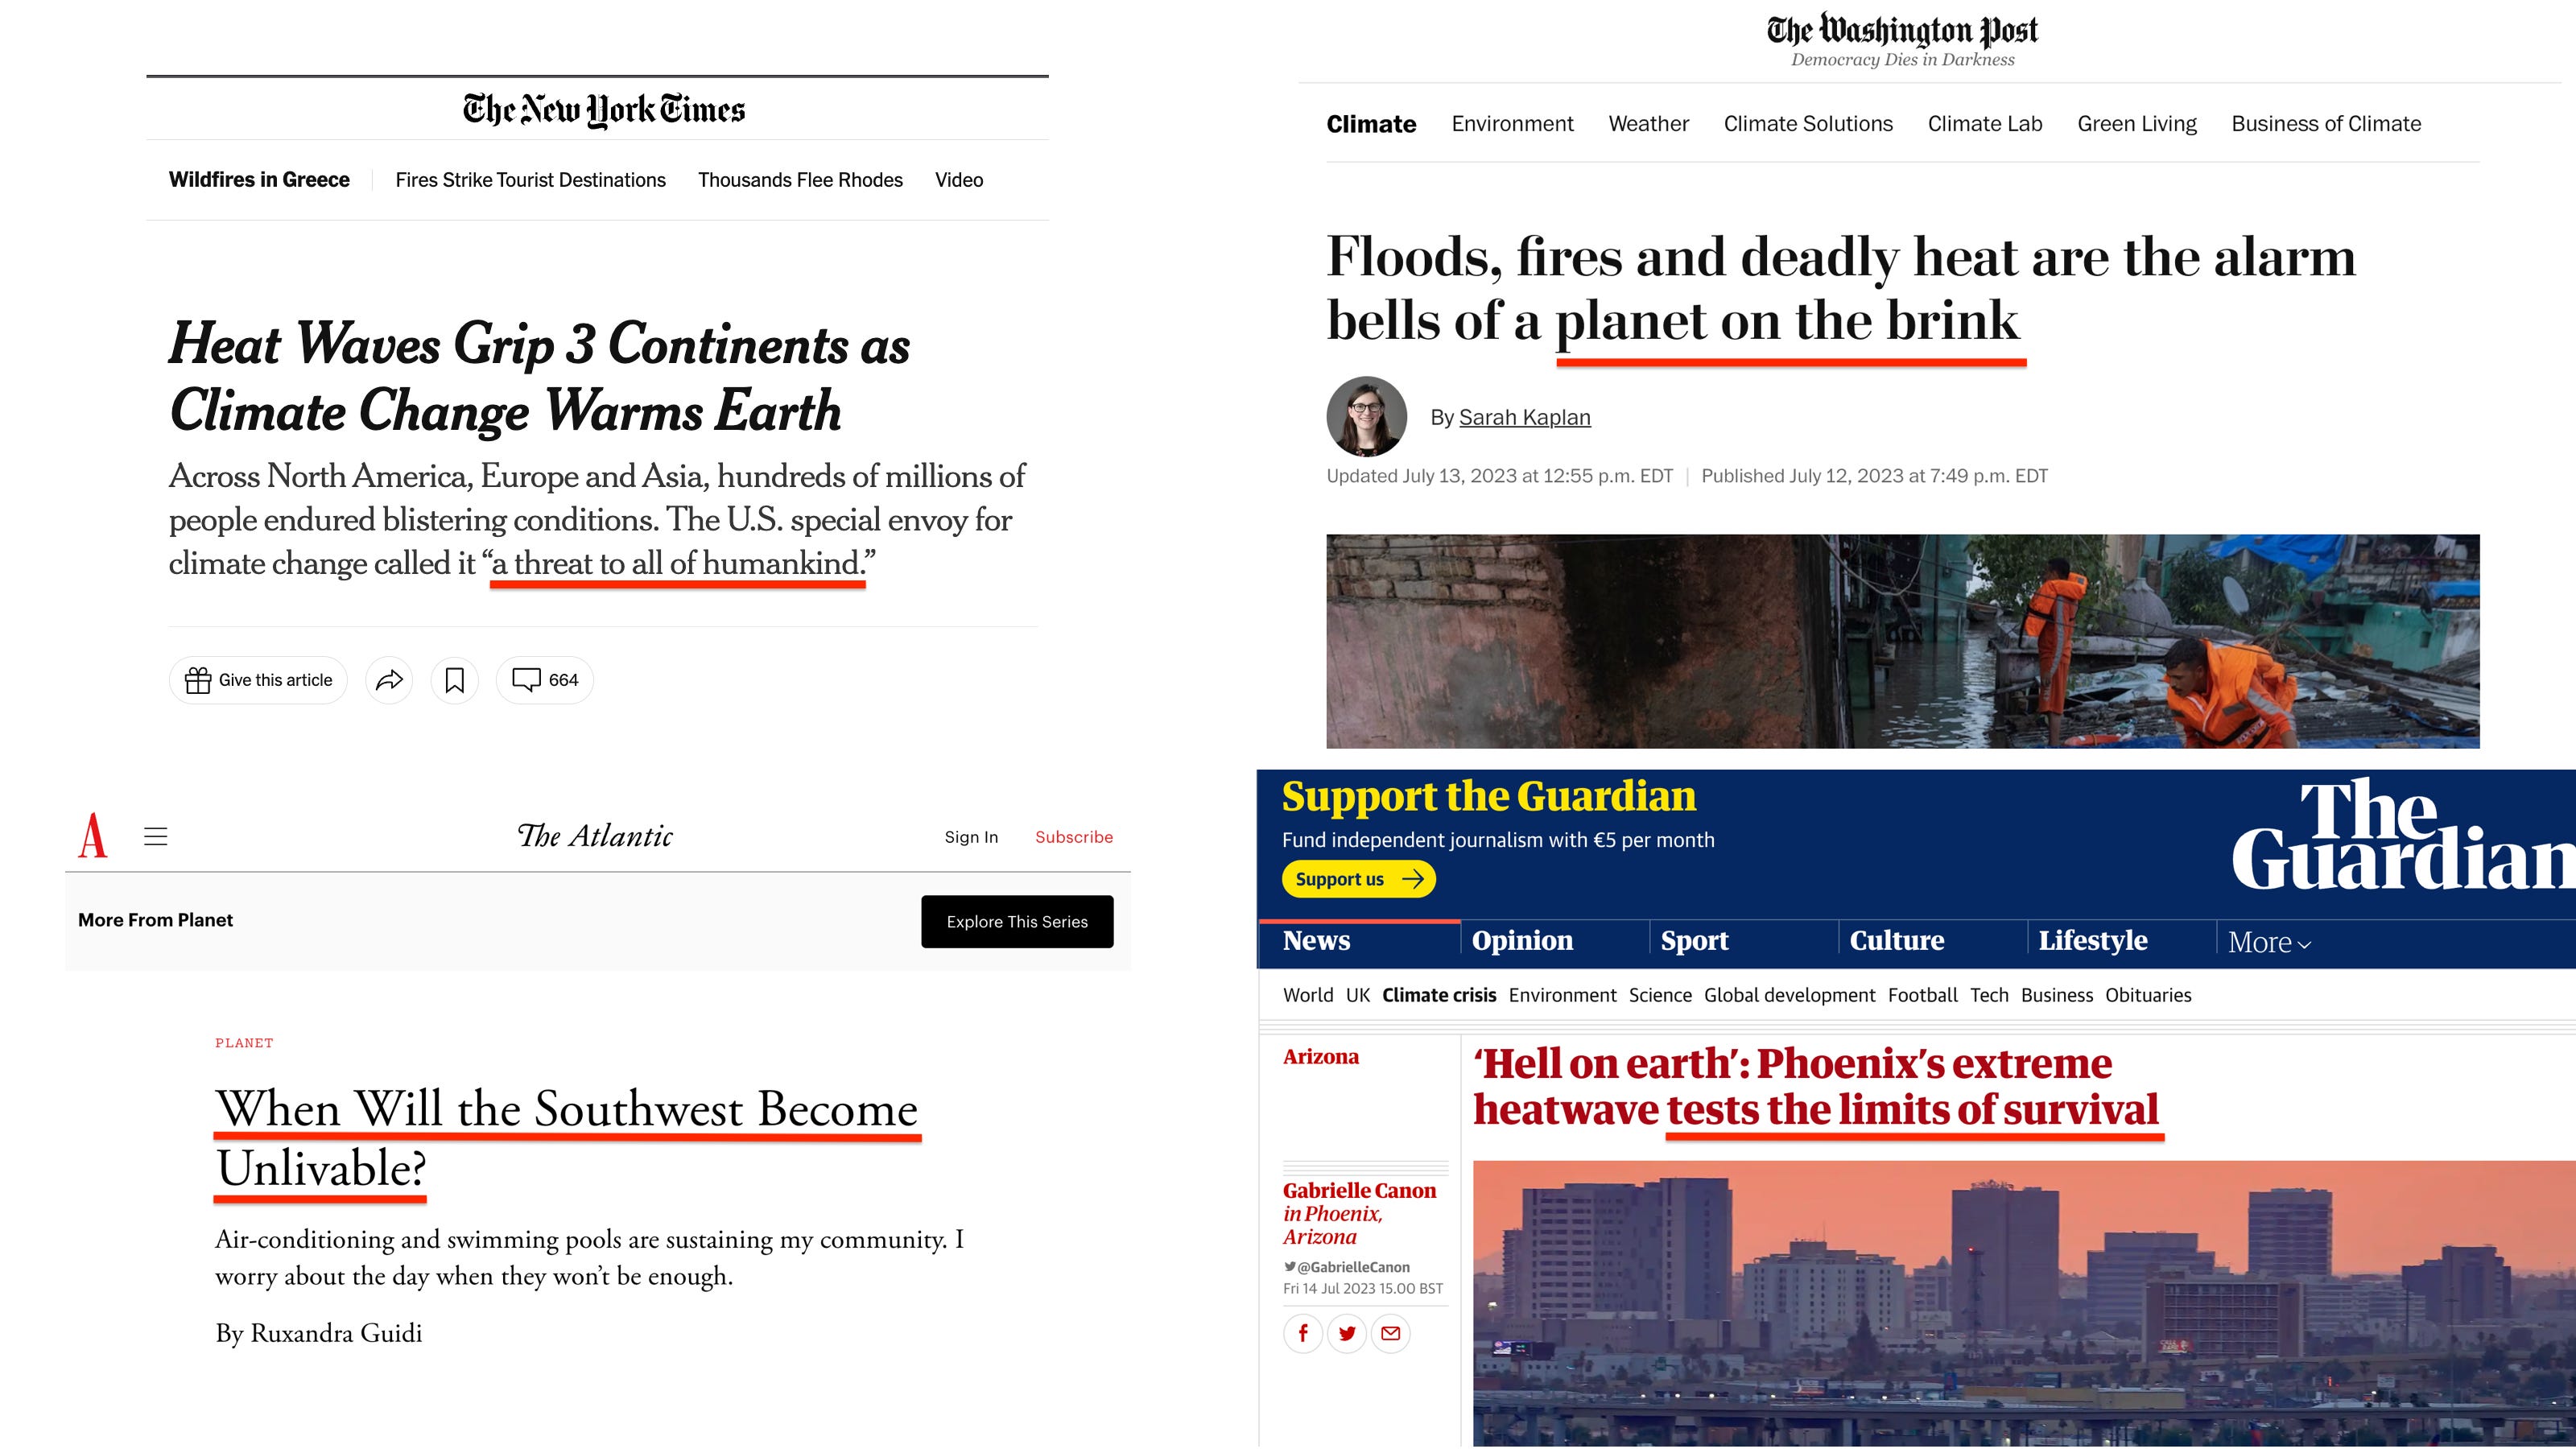
False media claims of hurricanes increasing in number and intensity because
of human-caused climate change.
Before we look
at where the mainstream media cut the data, let us look at a few examples of
what the mainstream media claims – viz., about major
hurricanes supposedly becoming more common:
❖ The New York
Times
claimed, “strong storms are becoming more common in the Atlantic Ocean.”
❖ A Washington
Post headline warned, “climate change is rapidly fueling super hurricanes”,
adding in the body of the article that “storms rated Category 4 or stronger …
have increased in number in recent decades”.
❖ ABC News
declared, “Here’s how climate change intensifies hurricanes.”
As we saw in
part one of this article, N.O.A.A. and (the science journal) Nature
studies conclude the opposite of what these mainstream media are telling
people. Further, we saw that the media “buried” those studies in silence. But
that media makes a show of using (but really abusing) the N.O.A.A.
data. See, for example:
➢ The New York
Times saying that it is relying upon the same NOAA report that we showed in
part 1, which concludes the opposite of what the media claims: https://www.nytimes.com/2022/09/29/briefing/hurricane-ian-storm-climate-change.html
And similarly:
➢ ABC News
claiming to rely on this NOAA report here: https://abc7.com/heres-how-climate-change-intensifies-hurricanes/12277318/
But before we
look at where the media cut the data, let us also look at an example of what the
mainstream media says about the frequency of all hurricanes:
➢ The Financial
Times
claimed in an alarmist headline: “hurricane frequency is on the rise.”
Again, N.O.A.A.
and the (science journal) Nature studies conclude the opposite of these
media claims, “burying” those studies in silence and yet making a show of using
(but really abusing) N.O.A.A. data.
The Leftists Deceptively Cut the Data at 1980.
Now let us look
at where the New York Times
article cut the data.
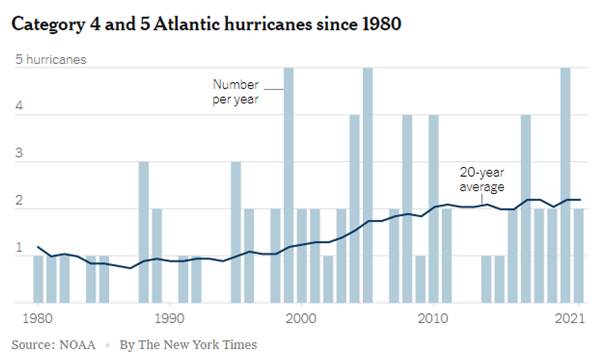
Notice the
above graph begins in 1980. Why didn’t the media use the longer data set that
is readily available? Because it would have shown the falsity of their claims.
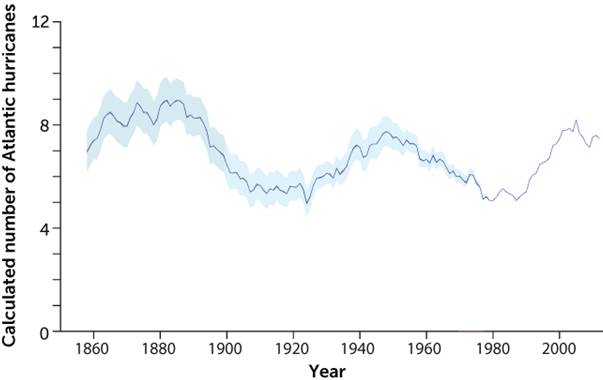
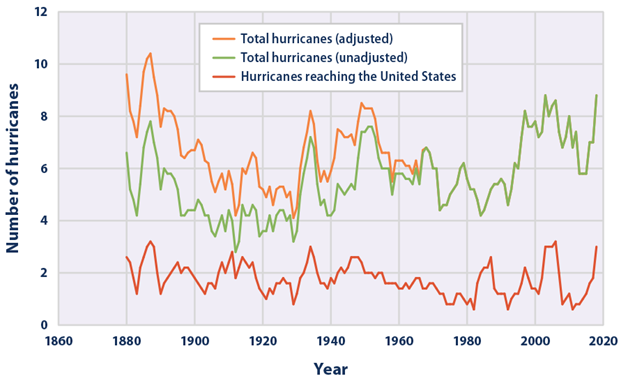
Here
(below), e.g., is a N.O.A.A. graph showing the larger data set that the
New York Times could have used (but did not use), going
back 120 years further, to 1860:
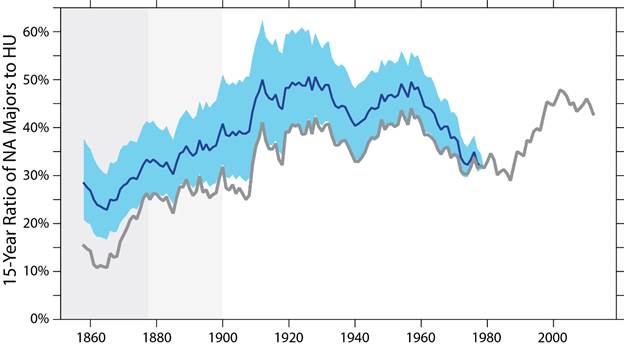
How different the data looks when we see
it in context – when it is not cut deceptively, as the New York Times
does! Reviewing the entire data set, we see it would be absurd to worry about
the hurricane cycle upswing beginning in 1980.
As shown in the Catholic Candle articles
which are linked to the introduction of part 1 of this present article, when
the temperature cycle was on a significant cooling trend, the climate alarmists
tried to scare the public about the cooling being permanent and that we were
entering a permanent “new ice age”. Then, when the inevitable warming cycle
began after that, they switched their scare tactics to “global warming” – all to
promote increased government intrusion in people’s lives, a globalist power
grab.
But notice that the current scare about
“stronger and more frequent hurricanes” did not have a predecessor scare when
the hurricane cycle was going in the opposite direction. The reason is
obvious: people would not be afraid (in the years preceding roughly 1980) that
climate change is causing a reduction in hurricanes. So, the leftists
had to wait to use hurricanes as a scare tactic until hurricanes began to rise out
of the 1980’s era “deep minimum”.
Conclusion of this Section about Mainstream Media Reporting
The mainstream media ignore the key
hurricane data in order to falsely claim that hurricanes are increasing in
number and severity because of human-caused climate change.
Climate change alarmism based on the
increased number and severity of hurricanes is deceptive and false and is aimed
at a globalist power grab because of the supposed need for the government to
regulate everything to “save us” from disaster.
This is a further reminder that the mainstream
media lie to us. They are not misguided bumblers who don’t succeed in their
attempt to publish the truth. Rather they are leftist liars who use every
opportunity to indoctrinate us to promote the false globalist narrative and
ongoing power grab.
The Increasing Cost of Hurricanes
Q. Is it true that hurricanes are
becoming more expensive?
A. Yes, but not because of climate change.
There has been a dramatic increase of
persons and property in “harm’s way” in hurricane-prone coastal areas because
the great increase in property development of the Gulf and Atlantic coasts (as
well as because of inflation) – all these circumstances are used by the
leftists to make hurricanes appear worse than 100 years ago.
This is one
more way for the climate scare-mongers to alarm people and promote their
globalist power-grab agenda. They declare that the increasing cost of
hurricanes – both the number and severity – show that climate crisis is a
“fact”.
It is true that
the cost of hurricanes is increasing, even when adjusted for inflation. See, e.g.,
a graph (below) courtesy of Munich Re, a very large global property insurer
with a huge loss database used for this graph.
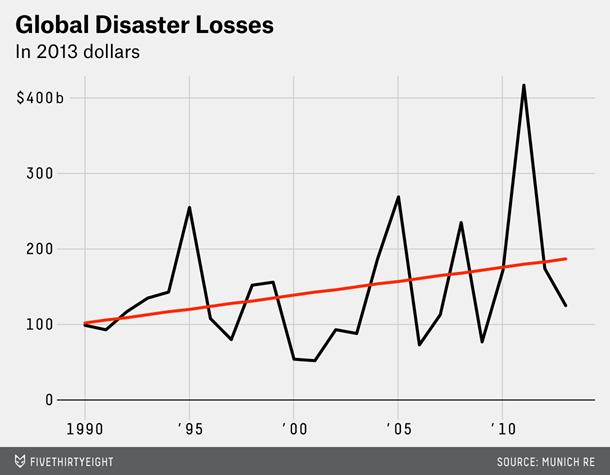
This graph is
available courtesy of Roger Pielke, Jr., in his article entitled: Disasters
Cost More Than Ever — But Not Because of Climate Change, available here: https://fivethirtyeight.com/features/disasters-cost-more-than-ever-but-not-because-of-climate-change/
Although in
this graph (above) we see the increasing cost of natural disasters, that
is only half of the picture. In fact, the upward trend in the cost of
natural disasters is because we are getting richer and have more goods and
property which can be destroyed in a disaster. In other words, even adjusting
for inflation, there is an increasing value of the property that
is “in harm’s way”.
Look at the
graph below, also courtesy of Munich Re. It shows that natural disasters do
destroy a higher value of property now but that value is proportional to our
increase in wealth. Owning more things means people have more things “in
harm’s way” and available to be damaged.

This graph is
available courtesy of Roger Pielke, Jr., in his article entitled: Disasters
Cost More Than Ever — But Not Because of Climate Change, available here: https://fivethirtyeight.com/features/disasters-cost-more-than-ever-but-not-because-of-climate-change/
Taking greater
wealth into account, the same level of storm frequency and severity does more
harm. You can see this is common sense. If a person 100 years ago owned a
dingy (row boat) docked on the Gulf Coast, he would be exposed to much less
property damage potential than his grandson who keeps a large yacht in the same
location during an equivalent storm.
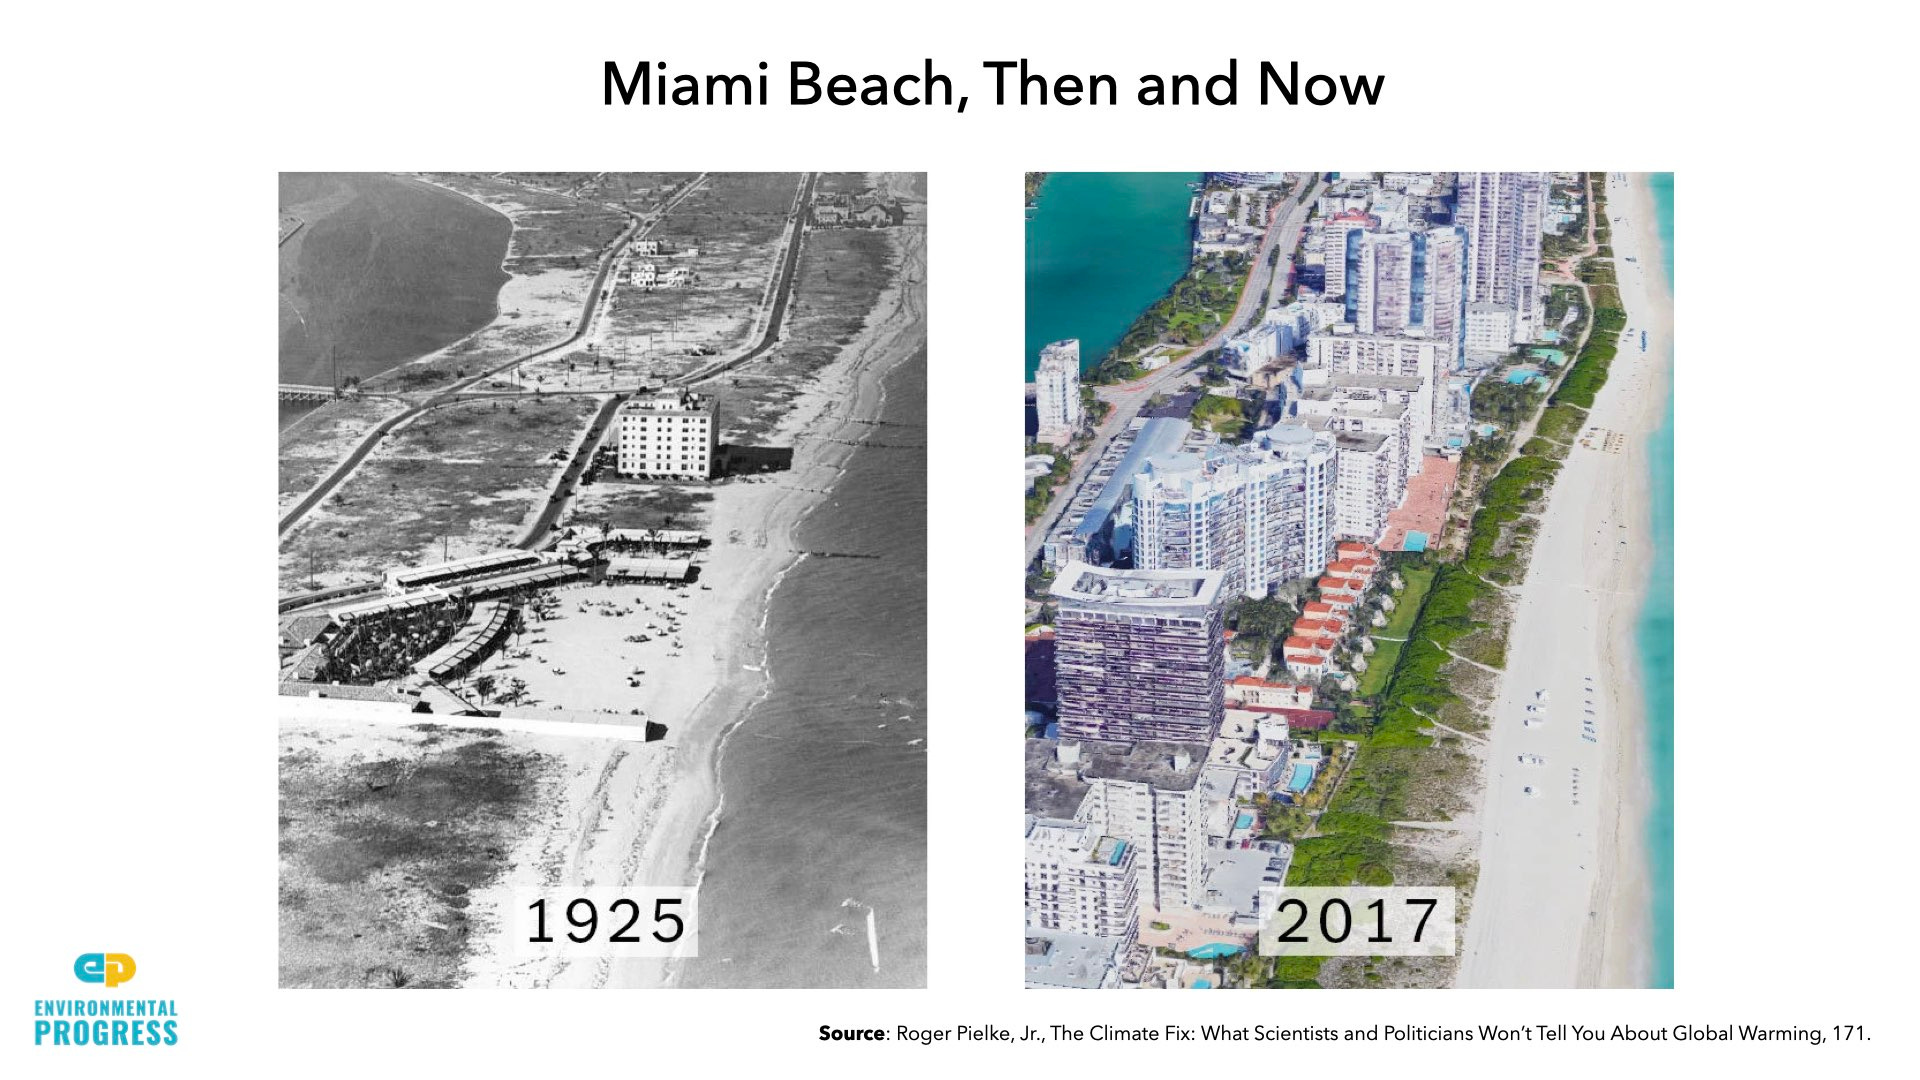
It is
especially striking how more people are moving into places which expose them to
adverse natural occurrences (hurricanes, mudslides, etc.).
Consider how much more developed Miami Beach is today compared
to a century ago. See below.
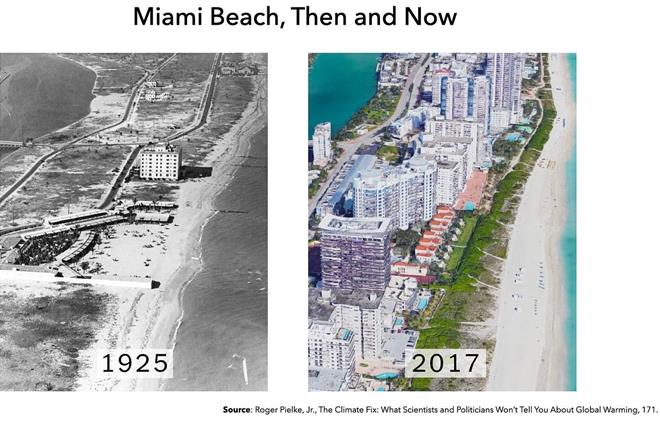
For this reason, if equal storms hit Miami Beach, Florida in
1925 and in 2017, the damage from the 2017 storm would be much greater because
there are so many more people and so much more property “in harm’s way”.
Similarly, look at the Houston, Texas skyline in 1927 (below)
and today (further below).

https://www.chron.com/news/houston-texas/houston/slideshow/Old-Houston-photos-159668.php
Current picture of the Houston skyline:
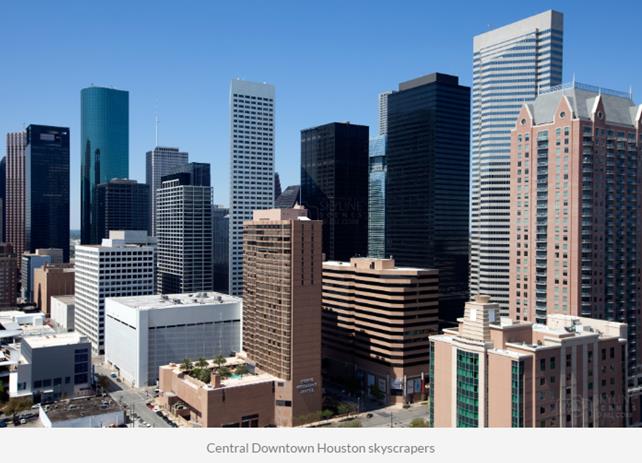
https://www.skylinescenes.com/products/downtown-houston-texas-v50010
Because people
are richer now than 100 years ago and because they (perhaps imprudently) place
more valuable property at risk in attractive but hazardous locations, it is no
wonder that a storm now would cause much more damage that an equal storm 100
years ago.
Leaving
aside the upward trend (“correction”) from the “deep minimum” in the hurricane
cycle which occurred in about the 1980s, there is no increase in the number and
the severity of hurricanes; yet the same severity and number of hurricanes now
often do more damage because there is more property “in harm’s way”.
In
fact, the coastal urban areas are actually safer than ever, when computed as the
number of persons killed by hurricanes, as a percentage of persons who are
located in those hurricane-prone areas. Here is how one recent study explained
this:
Abstract: … Here, [i.e.,
in this study] we report on impacts of global coastal storm surge events since
the year 1900, based on a compilation of events and data on loss of life. We
find that over the past, more than eight thousand people are killed and 1.5
million people are affected annually by storm surges [throughout the world].
The occurrence of very substantial loss of life (>10 000 persons)
from single events has, however, decreased over time. Moreover, there is
a consistent decrease in event mortality, measured by the fraction of exposed
people that are killed, for all global regions, except South East Asia.
Average mortality for storm surges is slightly higher than for river floods,
but lower than for flash floods. We also find that for the same coastal surge
water level, mortality has decreased over time. This indicates that risk
reduction efforts have been successful, but need to be continued with projected
climate change, increased rates of sea-level rise and urbanisation in coastal
zones.
For
example, Miami Beach had a population of 28,012 in 1940 and has a
population of 80,671
now. Because the city of Miami Beach has about three times as many people as
it did 60 years ago, there are so many more people “in harm’s way” even though
each person who is there is safer than he would have been in earlier decades.
Further,
just as hurricane fatalities are not increasing as a percentage of the people
who are living “in harm’s way”, likewise, the studies show that the amount of
damage that hurricanes cause is not increasing when we take into account that
people are bringing greater wealth into hurricane zones. Here is how one study
explained this fact:
In recent years claims have been
made in venues including the authoritative reports of the Intergovernmental
Panel on Climate Change and in testimony before the US Congress that
economic losses from weather events have been increasing beyond that which can
be explained by societal change, based on loss data from the reinsurance
industry and aggregated since 1980 at the global level. Such claims imply a
contradiction with a large set of peer-reviewed studies focused on regional
losses, typically over a much longer time period, which concludes that loss
trends are explained entirely by societal change. To address this implied
mismatch, we disaggregate global losses from a widely utilized reinsurance
dataset into regional components and compare this disaggregation directly to
the findings from the literature at the regional scale, most of which reach
back much further in time. We find that global losses increased at a rate of
$3.1 billion/year (2008 USD) from 1980–2008 and losses from North American,
Asian, European, and Australian storms and floods account for 97% of the
increase. In particular, North American storms, of which U.S. hurricane losses
compose the bulk, account for 57% of global economic losses. Longer-term loss
trends in these regions can be explained entirely by socioeconomic factors in
each region such as increasing wealth, population growth, and increasing
development in vulnerable areas. The remaining 3% of the global increase 1980
to 2008 is the result of losses for which regionally based studies have not yet
been completed. On climate time scales, societal change is sufficient to
explain the increasing costs of disasters at the global level and claims to the
contrary are not supported by aggregate loss data from the reinsurance
industry.
Here
is the summary of a study where the researchers examined 106 years of hurricane
data to compare the cost of hurricane losses, after adjusting them for
inflation and for the amount of property “in harm’s way”:
Abstract: After more than two
decades of relatively little Atlantic hurricane activity, the past decade saw
heightened hurricane activity and more than $150 billion in damage in 2004 and
2005. This paper normalizes mainland U.S. hurricane damage from 1900–2005 to
2005 values using two methodologies. A normalization provides an estimate of
the damage that would occur if storms from the past made landfall under another
year’s societal conditions. Our methods use changes in inflation and wealth at
the national level and changes in population and housing units at the coastal
county level. Across both normalization methods, there is no remaining
trend of increasing absolute damage in the data set, which follows the
lack of trends in landfall frequency or intensity observed over the twentieth
century. The 1970s and 1980s were notable because of the extremely low amounts
of damage compared to other decades. The decade 1996–2005 has the second most
damage among the past 11 decades, with only the decade 1926–1935 surpassing its
costs. Over the 106 years of record, the average annual normalized damage in
the continental United States is about $10 billion under both methods. The
most damaging single storm is the 1926 Great Miami storm, with $140–157 billion
of normalized damage: the most damaging years are 1926 and 2005. Of the total
damage, about 85% is accounted for by the intense hurricanes Saffir-Simpson
Categories 3, 4, and 5, yet these have comprised only 24% of the U.S.
landfalling tropical cyclones.
This
last study predicts that hurricane damage will continue to trend upward because
more and more people and property are moving into the hurricane-prone areas.
Here is how the study concludes this:
Unless action is taken to
address the growing concentration of people and properties in coastal areas
where hurricanes strike, damage will increase, and by a great deal, as more and
wealthier people increasingly inhabit these coastal locations.
Conclusion
of the Entire Article
We see that:
➢ The climate
goes in cycles of various sizes from daily cycles to centuries-long cycles,
with other cycles in between.
➢ Hurricanes go
in cycles too – annual cycles and decades-long cycles. Perhaps hurricanes also
follow multi-year cycles and multi-century cycles but we will leave those
inquiries aside for now.
➢ NOAA and its studies
conclude that there is no trend toward increasing numbers or severity of
hurricanes, although these conclusions are buried and not publicized.
➢ In about the
1980s, there was a “deep minimum” of hurricane activity, which the leftists use
as the beginning of their data set to make the hurricane cycle’s returning to
normalcy falsely appear (to the gullible) as an alarming upward trend.
➢ The leftist
media and climate alarmists in the popular press falsely promote a supposed
climate emergency to worry people and attempt to grab power and take the
people’s freedom because this is “necessary” in order for mankind to survive.
➢ During the last
hundred years, there has been a dramatic increase in people and property being
located in hurricane-prone coastal areas. If we adjust for the large increase
in people in “harm’s way”, these coastal areas have become much safer and there
has been a dramatic decrease in the percentage of people killed in the areas where
hurricanes strike. Likewise, if we adjust for inflation and for the increase
in the value of property that people choose to bring into those areas,
hurricanes destroy a decreasing percentage of the property which is exposed to
storm hazards.
➢ Don’t be deceived
by the claim that man-caused climate change is causing an increase in the
number and severity of hurricanes.


